Epley's formula estimates a one-rep max (1RM) as weight × (1 + reps / 30), and Brzycki's as weight × 36 / (37 − reps). In 46 college women who benched 10 reps or fewer, seven common formulas averaged within 4% of the tested 1RM, and for any one woman each could be about 10% off (Mayhew 2008). At 20 reps the formulas differ by more than 75% of the weight on the bar.
What is the Epley formula?
Epley's formula takes a set done to failure and multiplies the weight by 1 plus a thirtieth of the reps. 100 kg / 220 lb for 5 reps gives 100 × (1 + 5/30) = 116.7 kg / 257 lb. Each rep adds 3.3% of the weight lifted, so the formula is a straight line.
Brzycki's formula (1993) divides instead: 1RM = weight × 36 / (37 − reps). Its estimate grows faster with every rep, and Brzycki recommended it for sets of 10 reps or fewer.
Five more are in common use. In each, w is the weight and r the reps to failure.
| Formula | Year | 1RM equals |
|---|---|---|
| Epley | 1985 | w × (1 + r/30) |
| Brzycki | 1993 | w / (1.0278 − 0.0278r) |
| Lander | 1985 | 100w / (101.3 − 2.67123r) |
| Lombardi | 1989 | w × r^0.10 |
| Mayhew | 1992 | 100w / (52.2 + 41.9e^(−0.055r)) |
| O'Conner | 1989 | w × (1 + 0.025r) |
| Wathen | 1994 | 100w / (48.8 + 53.8e^(−0.075r)) |
Brzycki's formula is usually written w × 36 / (37 − r), which gives the same numbers to the nearest kg. Lombardi's exponent is printed as 0.10 in some papers and 0.13 in others. The table uses 0.10.
Every formula assumes the set ended at failure. A set stopped with reps left needs those reps added first: 5 reps with 2 reps in reserve (RIR 2) is 7 reps to failure. RPE vs RIR covers how well lifters judge the reps they have left.
At a single rep, Epley returns 103.3% of the weight and Mayhew 108.9%. A single taken to failure is its own 1RM, so the 1RM calculator and Povver both return the weight lifted.
Do the 1RM formulas agree with each other?
Up to 10 reps, within about 10% of the weight lifted. Beyond that they split. The table runs all seven on one set, 100 kg / 220 lb to failure, so each number doubles as a percentage of the weight lifted.
| Formula | 5 reps | 10 reps | 15 reps | 20 reps |
|---|---|---|---|---|
| Epley | 116.7 | 133.3 | 150.0 | 166.7 |
| Brzycki | 112.5 | 133.4 | 163.7 | 212.0 |
| Lander | 113.7 | 134.1 | 163.3 | 208.9 |
| Lombardi | 117.5 | 125.9 | 131.1 | 134.9 |
| Mayhew | 119.0 | 130.9 | 141.7 | 151.2 |
| O'Conner | 112.5 | 125.0 | 137.5 | 150.0 |
| Wathen | 116.6 | 134.7 | 150.9 | 164.5 |
| Highest minus lowest | 6.5 | 9.7 | 32.6 | 77.0 |
Estimated 1RM in kg from 100 kg / 220 lb lifted to failure, computed by Povver, September 2026. As a percentage of the weight lifted, each number works in lb too.
Brzycki and Lander climb fastest because their denominators shrink toward zero as the reps rise. Lombardi flattens out.
At 20 reps, the choice of formula alone moves the estimate by 77 kg / 170 lb on a 100 kg / 220 lb set.
Which 1RM formula is most accurate?
At 10 reps or fewer, no 1RM formula stands out. Mayhew and colleagues (Journal of Strength and Conditioning Research, 2008) tested 14 formulas against a measured bench press 1RM in 103 college women, before and after 12 weeks of training. Before training, 46 of them did 10 reps or fewer on their test set, and reps across the whole group ran from 2 to 20.
| Formula | 10 reps or fewer (46 women) | 2 to 20 reps (103 women) |
|---|---|---|
| Epley | +0.5% (SD 10.2) | +5.3% (SD 11.0) |
| Brzycki | −2.0% (SD 10.5) | +26.7% (SD 101.7) |
| Lander | −1.1% (SD 10.5) | +22.9% (SD 70.7) |
| Lombardi, exponent 0.13 | −0.9% (SD 9.2) | −4.9% (SD 9.7) |
| Mayhew | +1.6% (SD 9.4) | +1.2% (SD 9.0) |
| O'Conner | −3.7% (SD 9.1) | −2.1% (SD 9.0) |
| Wathen | +0.7% (SD 10.6) | +4.9% (SD 10.5) |
Mean error of each estimate against the tested bench press 1RM, before training, with its standard deviation. Mayhew and colleagues 2008, Tables 3 and 4. The paper lists Epley's formula under Welday.
At 10 reps or fewer, the averages for these seven ran from −3.7% to +1.6%, and for one woman every formula's estimate could be off by 9 to 11% either way (the standard deviations). Over the whole range, Brzycki and Lander overshot by more than a fifth on average, with standard deviations of 70% and more. Mayhew's exponential formula held up best across the range.
A 1995 study by the same group tested six formulas on 220 men, from untrained students to football players. At 10 reps or fewer, Brzycki's was the most accurate. Above 10, every one of the six missed significantly, three too high and three too low, and the authors suggested averaging two formulas. In 69 college football players pressing 102 kg / 225 lb for reps, the 11 formulas tested came closer to the real max the fewer reps a player did (Whisenant and colleagues, 2003).
At 10 reps or fewer, Epley, Brzycki, Lander or Wathen will do: in Mayhew's data all four averaged within 2% of the real max.
How accurate is a 1RM calculator at 10 reps?
At 10 reps the formulas land between 125% and 135% of the weight lifted, and one person's estimate can be about 10% off in either direction (Mayhew 2008). A lifter who benches 100 kg / 220 lb for 10 gets an estimate near 130 kg / 287 lb, and their real max could be anywhere from 120 kg / 265 lb to 140 kg / 309 lb.
Lifters differ in how many reps they get at a given share of their max. Nuzzo and colleagues (Sports Medicine, 2024) pooled 269 studies of reps to failure at a fixed share of 1RM. At 80% of 1RM, people managed 9.75 reps on average, with a standard deviation of about 2.5 reps. The leg press ran to more reps than the bench press at every load, 13.1 against 8.8 at 80%.
Reynolds and colleagues (2006) tested 70 men and women at 1, 5, 10 and 20 reps on the bench press and the leg press. The load fell along a curve as the reps rose, and the 5-rep max predicted the 1RM best. They advise using no more than 10 reps in a linear equation such as Epley's.
A set stopped short of failure adds one more error, because lifters misjudge their reps left by about one, on average thinking they have fewer left than they do (Halperin 2022). That biases the estimate low.
For the most accurate estimate from one set, use a set of about 5 reps taken to failure, or close to it with an honest RIR. The 1RM calculator runs all seven formulas on your set and gives a likely range beside the number.
How Povver estimates your 1RM each week
Povver runs Epley on every working set you log, with your reps in reserve added to the reps. Eight reps at RIR 2 counts as 10 to failure. A logged RIR above 3 counts as 3, because 3 reps left (RPE 7) is the last point on the RIR-based RPE scale that maps to a single rep count (Zourdos 2016). A set logged without RIR counts as taken to failure, and a single with nothing left is its own 1RM.
In Mayhew's data Epley averaged within 0.5% of the tested max at 10 reps or fewer. It is a straight line, so it also works in reverse: it predicts how many reps you will get at a new weight, which is how Povver sizes the next step on a lift.
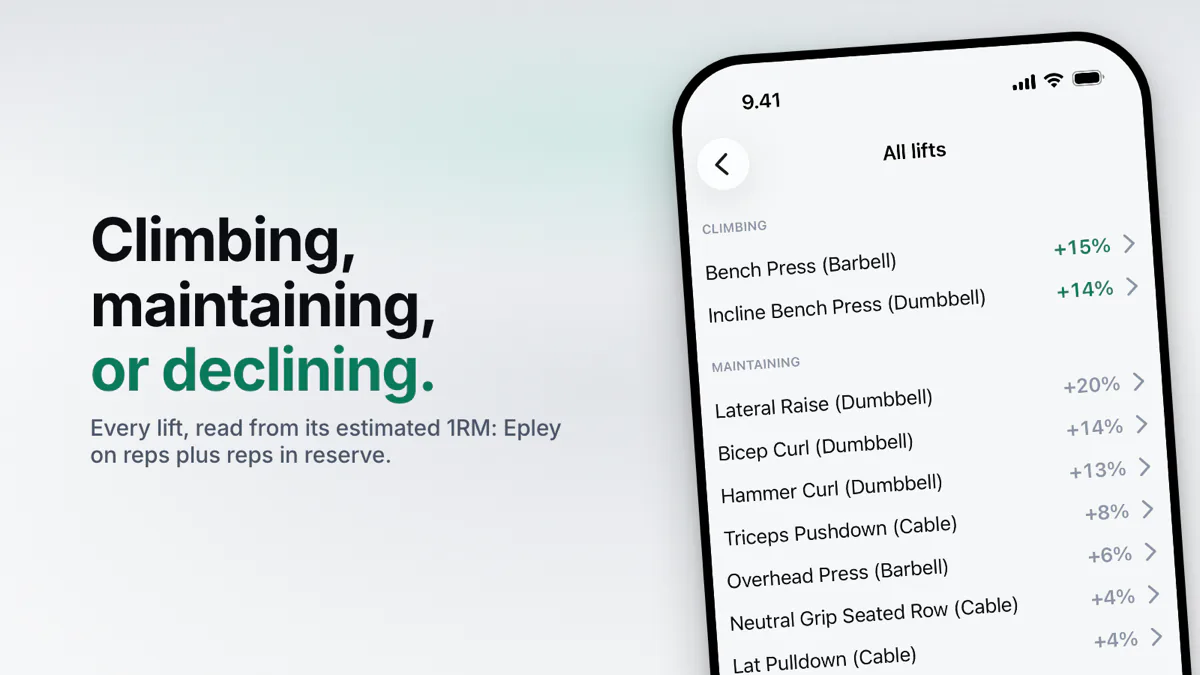
Each week, your best set on a lift gives that week's estimate, so a light back-off day never pulls the number down. The Intelligence tab charts the last eight weekly estimates. Once three of the last six calendar weeks have an estimate, it labels the lift from those weeks. When the last three weeks sit within 4% of the latest, the lift is maintaining. If not, a rise of 2% or more since the first estimate in those six weeks reads as climbing, and a fall of 2% or more as declining. Either label needs the weeks to follow a steady trend.
The percentage beside each lift is its change over all eight weeks, so a lift can show +20% and still read maintaining when its last three weeks sat level.
A formula that reads 3% high at 8 reps reads 3% high every week you do 8 reps, so the line still shows the change. Povver judges the lift on that line of weekly estimates.
Sources
- Mayhew JL, Johnson BD, LaMonte MJ, Lauber D, Kemmler W, "Accuracy of Prediction Equations for Determining One Repetition Maximum Bench Press in Women Before and After Resistance Training", Journal of Strength and Conditioning Research 2008. doi.org/10.1519/JSC.0b013e31817b02ad
- Mayhew JL, Prinster JL, Ware JS, Zimmer DL, Arabas JR, Bemben MG, "Muscular endurance repetitions to predict bench press strength in men of different training levels", Journal of Sports Medicine and Physical Fitness 1995. pubmed.ncbi.nlm.nih.gov/7500624/
- Reynolds JM, Gordon TJ, Robergs RA, "Prediction of One Repetition Maximum Strength from Multiple Repetition Maximum Testing and Anthropometry", Journal of Strength and Conditioning Research 2006. doi.org/10.1519/R-15304.1
- Whisenant MJ, Panton LB, East WB, Broeder CE, "Validation of submaximal prediction equations for the 1 repetition maximum bench press test on a group of collegiate football players", Journal of Strength and Conditioning Research 2003. pubmed.ncbi.nlm.nih.gov/12741856/
- Brzycki M, "Strength Testing: Predicting a One-Rep Max from Reps-to-Fatigue", Journal of Physical Education, Recreation and Dance 1993. doi.org/10.1080/07303084.1993.10606684
- Nuzzo JL, Pinto MD, Nosaka K, Steele J, "Maximal Number of Repetitions at Percentages of the One Repetition Maximum: A Meta-Regression and Moderator Analysis of Sex, Age, Training Status, and Exercise", Sports Medicine 2024. doi.org/10.1007/s40279-023-01937-7
- Halperin I, Malleron T, Har-Nir I, et al., "Accuracy in Predicting Repetitions to Task Failure in Resistance Exercise: A Scoping Review and Exploratory Meta-analysis", Sports Medicine 2022. doi.org/10.1007/s40279-021-01559-x
- Zourdos MC, Klemp A, Dolan C, et al., "Novel Resistance Training-Specific Rating of Perceived Exertion Scale Measuring Repetitions in Reserve", Journal of Strength and Conditioning Research 2016. doi.org/10.1519/JSC.0000000000001049
